One of the features that is unique to the MySOYL website is the ability to view previous sampling results and compare how your nutrient levels change over time. Of course you could find previous paper maps, print them out and lay them next to each other, but I think we all agree that feels like hard work!
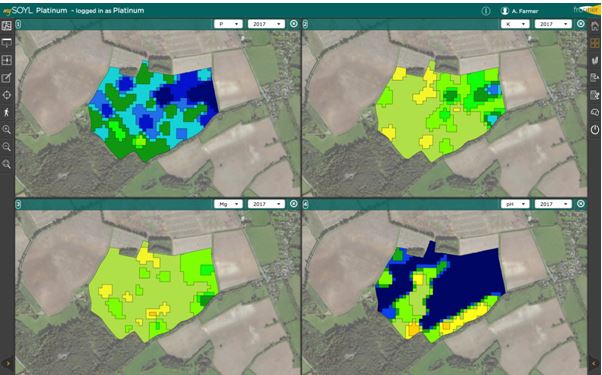
It is important to remember that nutrient data is relevant for a period of four years. So the image below shows the phosphate, potassium, magnesium and pH results for 2017. This field was sampled in August 2014, so the same nutrient maps are relevant for the following four years. The field will be re-sampled in August 2018. So in MySOYL there will be no difference in the nutrient maps for those four years.
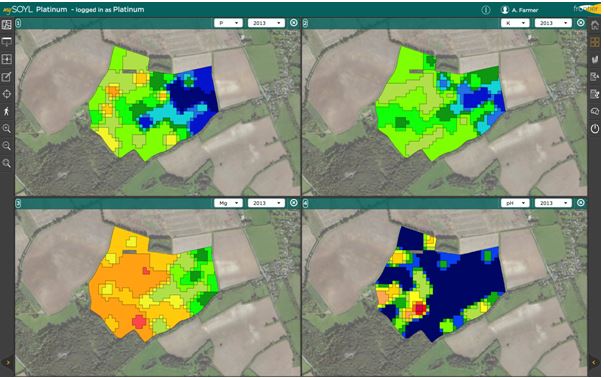
In order to view the previous set of results, the year needs to be changed to 2013, or earlier, for this field - this will change depending on when fields were sampled.
To compare the fields, select a combination of years. Below I have selected phosphorous for 2017 and 2013 to see how the field has changed visually.
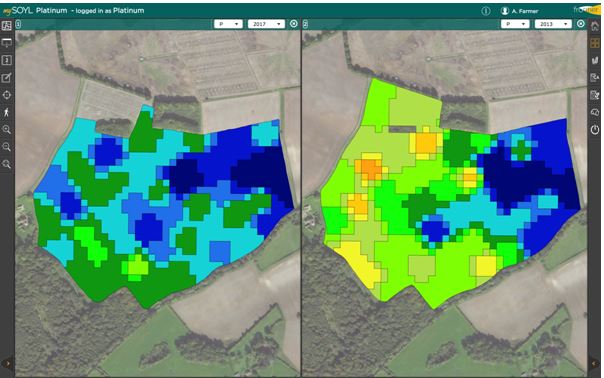
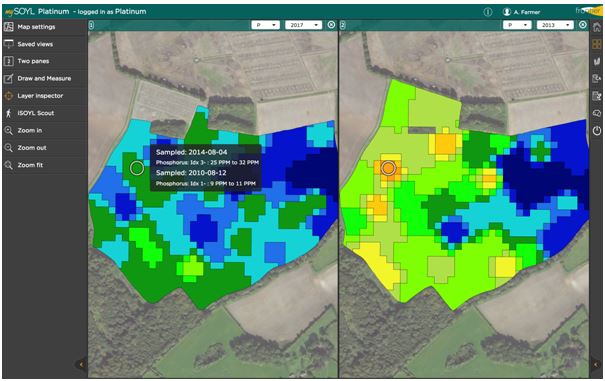
Broadly I can see that the west part of the field has improved in P index, but I could use the 'Layer Inspector' tool to see how levels have changed exactly, by clicking the tool on either map.
For further assistance, please call the SOYL team on 01635 204190 or email This email address is being protected from spambots. You need JavaScript enabled to view it..
- Home

- Resources
- MySOYL Tips & Tricks
- Viewing Data
- Viewing re-sample data
Viewing re-sample data